From Raw Data to Ready Dashboard: Introducing the Buildlogic Report Builder
If you’ve ever waited days for a report request to work its way through a development queue, or rebuilt the same Excel pivot table every week until it quietly went out of date, you know the problem. The data your business needs to make good decisions is almost always sitting in the system somewhere. The hard part has never been capturing it — it’s getting it in front of the right person, in the right shape, at the right time.
That’s exactly what the new Report Builder is built to fix.
Self-Service Reporting, Built Into Buildlogic
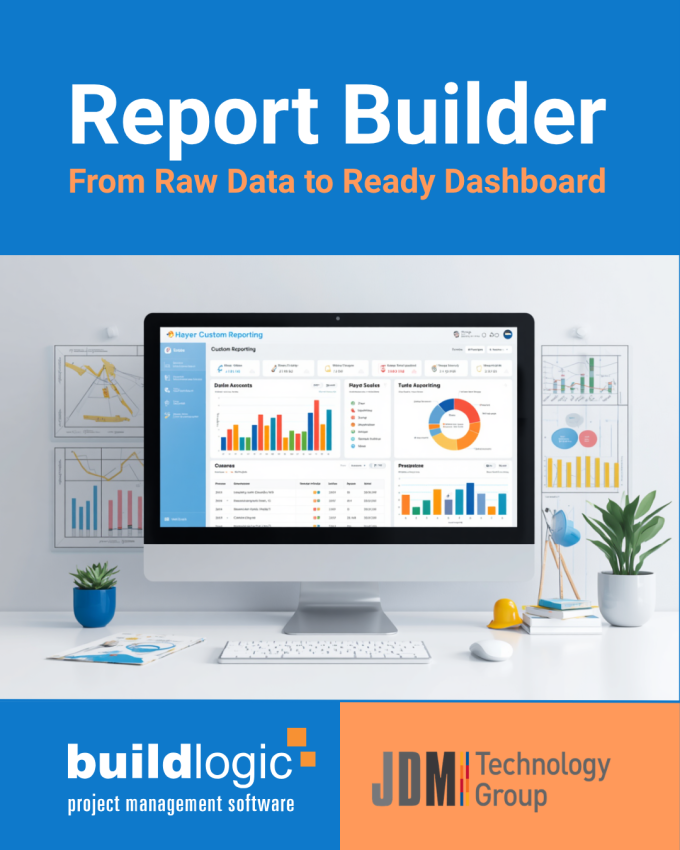
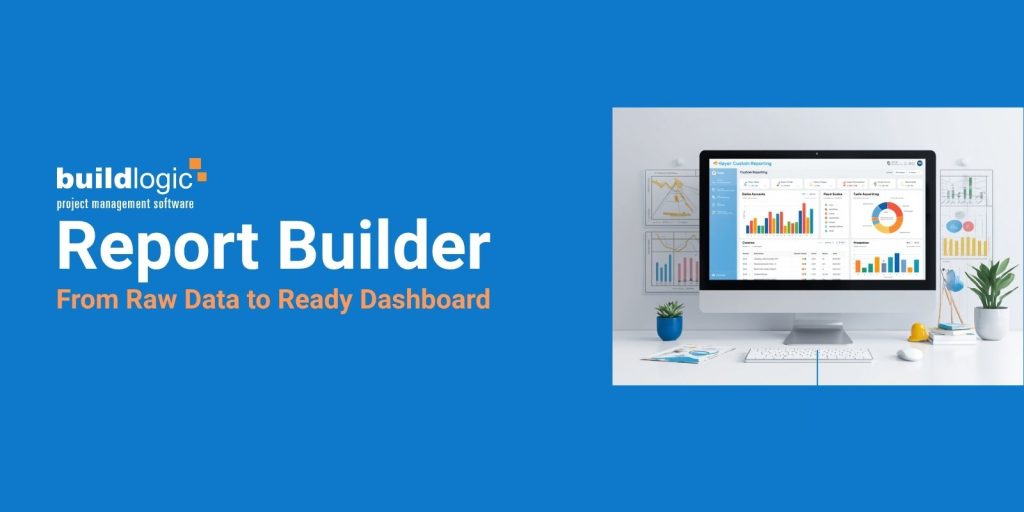
The Report Builder is self-service reporting built directly into the Buildlogic platform your team already uses. No developer ticket. No manual export. No waiting on IT. In four guided steps, anyone on the team can go from a raw dataset to a live, saved widget on their dashboard.
- Choose a dataset — jobs, purchase orders, progress claims, cost-to-complete forecasts, timesheets against budget, and more, all already connected and already up to date.
- Pick a widget type — a table for detail, a chart for trends, a progress bar for at-a-glance status, a ranked list for top or bottom performers, or a pivot table to cross-tabulate two fields at once.
- Configure it — choose columns, set the sort order, group and filter the data, all with dropdowns and checkboxes. No formulas, no code.
- Preview, then save — see exactly what the finished widget looks like before committing to it, then add it to “My Report Widgets” for the whole team to reuse.
Five Ways to See the Same Data
A single dataset rarely tells one story. Cost-to-complete by job and trade answers a different question depending on how you look at it, so the Report Builder doesn’t force you to choose:
- Table — raw detail, sortable, filterable, groupable
- Chart — bar, line, pie, or doughnut, for spotting trends at a glance
- Progress Bar — actual versus target or budget, for an instant read on whether a job is on track
- Ranked List — the top or bottom N by value, like which jobs are over budget or which suppliers cost the most
- Pivot Table — cross-tabulate any two fields, like job against trade or supplier against month, with totals calculated automatically
Take the Cost to Complete dataset as an example. Ranked by value and totalled automatically, it becomes a cross-tabulated pivot table with job down the rows and trade across the columns. Switch the view, and the same numbers become a bar chart of remaining balance by job — a different question, answered from the same underlying data, with no re-entry required. Both widgets take under five minutes to build, using nothing but dropdowns and checkboxes.
Why It Matters
- Live, not static. Every widget renders against current data in Buildlogic, not a snapshot that’s already stale by the time it’s exported.
- No technical skill required. If you can use a dropdown menu, you can build a report.
- A growing personal library. Save widgets to “My Report Widgets,” then preview, edit, or delete them any time.
- Export anywhere. Send the same widget to Excel, CSV, JSON, or a PNG image — feed a dashboard and a client email from the exact same report.
- Built in, not bolted on. No new login, no separate BI tool to learn. It’s part of the platform your team already uses every day.
Use the Best Australian Construction Management Software
Still relying on spreadsheets, paperwork, emails, and disconnected systems to manage your construction projects?
Buildlogic helps builders improve productivity, strengthen compliance, reduce administration, and gain real-time visibility across every project—all backed by a local Australian team that understands construction.
 Book a Personalised Demonstration
Start Your FREE 14-Day Trial
Buildlogic is the logical choice.